CHAPTER 4 CHAPTER 5 CHAPTER 6 CHAPTER 7
CHAPTER 4:
Fundamentals of Population Geography (de Blij & Murphy)
KEY POINTS:
1)
World’s
population is growing @ 90 million/yr., bulk is in poorer countries
2)
World’s
3 largest population concentrations in
3)
Population
data often are unreliable due to cost and organizational challenges of census
taking
4)
Population
density can be measured on the basis of several different criteria, revealing
contrasting aspects in demography
I) Population Geography – deals with growth, composition, and distribution of people in relation to spatial variations in physical and cultural geographic conditions.
Demography – study
of patterns and rates of population change, including birth & death rates,
migration trends, and evolving population patterns (population geography).
Today’s World Population
|
Region |
Area
(%) |
Pop
(%) |
|
29 |
61 |
|
|
20 |
13 |
|
| N.
Am. |
16 |
8 |
| S.
Am. |
14 |
6 |
|
9 |
0 |
|
|
7 |
12 |
|
|
6 |
0.5 |
II) Key Issues in Population Geography:
A)
Population growth
1)
Environments
and natural resources strained by needs of mushrooming population
2)
Population has increased fourfold
from its level a hundred years earlier
B)
Food
supply
1)
1960’s
– population growth outrunning rate of increase in grain harvests
(malnutrition & hunger seemed imminent)
2)
1970’s
– advances in technology; higher-yielding strains of rice, wheat,…
3)
1990’s – combination
of population growth and changing eating habits (more meat) could lead to a
global crisis (feed grains rather than food grains)
C)
Health
1)
Rapidly
growing populations can produce reservoirs
of disease (e.g. remote equatorial areas)
2)
Other
aspects (infant and child mortality rates) are matters of concern (mostly in
poorer nations)
-
Total Fertility Rate (TFR) – higher in poorer nations (further strains
economies, families)
D)
Status
of women
1)
Statistics
often fail to reflect differences between men and women. (
2)
When
governments that instituted measures to reduce population growth, the impact
fell disproportionately on females (e.g.
E)
Migration
1)
Immigration
sometimes adds more total population than natural increase
2)
Governments
have tried to limit immigration with meager success
3)
Major
population movements may occur within a
country (e.g. ethnic conflict, civil war, impovershment in rural areas,…)
F)
Reliability
of Data
1)
Census
and population data are based on careful assessments, yet are inherently
unreliable; cost, organization, and reporting are major obstacles
2)
Data collected by UN,
Census Bureaus, World Bank, Pop. Reference Bureau, …
III) Elements of Population Geography
A)
Population
and Space
1)
Humanity has always been
unevenly distributed over the land, contrasts have intensified (e.g.
2)
Mushrooming
urbanization (rural, farm-based areas transformed into urban, trade-based areas)
dominant theme of 20th century and beyond.
B)
Population
Distribution and Density
1)
Distribution
– the arrangement of something across Earth’s surface, where individuals or
groups (depending on scale) live
a)
Dot
Map – best representation
b)
No
country has an evenly distributed population
2)
Density
– number of people per unit area
a)
Arithmetic
population density – total number of people divided by the total land area
1)
US:
71/sq. mi.
2)
Subject
to error; does not take account of clustering
b)
Physiologic
density – number of people per unit of area of arable land (suitable for
agriculture)
1)
2)
Subject to error;
farmlands of different productivity
IV)
Major Population
Concentrations:
A)
1) One quarter of world’s population (~1.5 billion)
2) Pop. density declines from coastal zone toward interior
3) Ribbon-like extensions of dense population (clustered near rivers; majority of people are farmers)
B)
1) 1.5 billion
2)
Ribbon (finger)-like
extensions of dense population (e.g.
3)
Region marked by
physical barriers: Himalaya Mts., desert west of
C) Europe – third major concentration; Britain to Russia, including Germany, Poland, Ukraine, Belarus, Netherlands, Belgium, parts of France, northern Italy
1) 700 million
2)
Ribbon-like extension
deep into
3)
Comparatively dense
populations in mountainous, rugged areas (
4)
Includes numerous cities
& towns (Industrial Revolution;
D)
1) <200 million
2)
Like
3)
Megalopolis – huge
urban agglomeration;
E) Other Concentrations and Considerations
1)
2)
a)
Pattern
of agglomeration resembles
3) Level of Technology – increases a country’s ability to support population
a)
b)
CHAPTER
5: Processes and Cycles of
Population Change
KEY
POINTS:
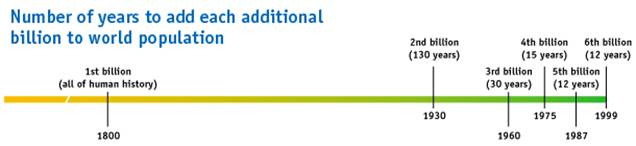
1)
The population explosion of the past 200 years has increased from 1
billion to 6 billion.
2)
Although hundreds of millions remain inadequately nourished, the threat
of global hunger has receded – perhaps temporarily.
3)
Rapid population growth varies over time and space.
4)
Keys to reduction of population growth rates include providing greater
access to education for women and securing their rights in society.
5)
The demographic transition model suggests that the world's population
will stabilize in the twenty-first century, but the model may not be universally
acceptable.
I)
Worldwide Population Trends
A)
World Growth Rate
1)
Adding about 80 million people every year; most increase is in areas that
are least able to support new arrivals
2)
Growth rate of world's population declined from 2.1% per year during
1965-69 to 1.6% during 1985-89. (Today = ~1.4%)
3)
Even while global population growth rate has continued to decline, the
reduction has been offset by the even larger total on which it is based.
4) Fastest growth in
Subsaharan Africa, South Asia & Muslim countries.
Smallest in
II)
Dimensions of Population
Growth
A)
Arithmetic
(linear) Growth
1)
Increases
occur in uniform amounts.
2)
Human
population has not expanded in a linear manner.
B)
Exponential
Growth
1)
Cumulative
or compound growth over a period of time.
2)
Human
population increases this way.
C)
Doubling
time (70/rate of increase)
1)
The
time required for a population to double in size.
2)
Rates of Population
Growth and Doubling Time:
|
Rate
of Increase (%) |
Doubling
Time (yrs.) |
Example
(1998) |
|
0.50 |
140 |
|
|
1.00 |
70 |
|
|
2.00 |
35 |
|
|
3.50 |
20 |
3) Population Explosion
a) History of humanity is one of growing numbers and even higher rates of increase
b) 2000 yrs. ago – 250 million: doubling time 16 centuries (1650)
c) 1650 – 500 million: doubling time 170 yrs. (1820) …
d) 2000 – doubling time reduced to 35 yrs. (>6 billion currently)
D) Stabilizing Population Level (SPL)
1) Theory that populations will stop growing (e.g. some Western European nations)
2) Population increase is a cyclic phenomenon – lags, spurts, regional disparities
III)
Population
Theories
A) Malthusian
1) 1798 – Thomas Malthus claims population increasing faster (geometric) than food production (arithmentic)
2) Did not foresee colonization, migration, Green Revolution, …
B) Boserupian
1) Technology will increase food production, counterbalance population increase
C) Cornucopian
1) Plenty of natural resources and food, world cannot become overcrowded
IV)
Population
Structures
A) Graphic representation (profile) of a population according to age and sex.
B) Age-Sex Pyramid – shows population composition (structure)
1) Graphic representation (profile) of a population showing the percentages of the total population by age and sex, normally in five-year groups (cohorts)
2) Sexes are placed on the left (males) and the right (females)
3) Broad bases = high fertility and mortality rates
4) Narrower bases = lower fertility and mortality rates
Source:
United Nations, World Population Prospects, The
1998 Revision.
V)
Demographic Cycles
A) Natural Increase = Crude Birth Rate (CBR) – Crude Death Rate (CDR)
1) CBR – not solely related to economic condition (e.g. poor countries have high birth rates)
2) CDR – (a.k.a. mortality rate) includes infant mortality (increases the rate)
B) Total Fertility Rate (TFR)
1) Number of children born to women of childbearing age
2) TFR usually reported as number of children per woman
3)
Generally,
the age at which a woman first marries is directly related to the number of
children she will bear because it affects the length of time she will be at risk
of becoming pregnant.
4)
Access
to contraception is an important contributor to the differences in the fertility
rates among countries, but culture and socioeconomics weigh heavily as well.
C) Population Changes
1) Limits on Population
a)
Epidemics, plagues (e.g.
1348-50
b)
Famines (e.g. 18th
& 19th c.
c) Wars (e.g. World Wars I & II)
2) Second Agricultural Revolution & Industrial Revolution
a) Farming methods improve, crop yields increase, improved storage capacities
b) Improved sanitation facilities, medical advancements (e.g. vaccination)
c) Increased migration – leads to colonization (widespread epidemics)
VI)
Demographic Change
A)
TP = OP + B – D + I
– E; takes immigration and emigration into account
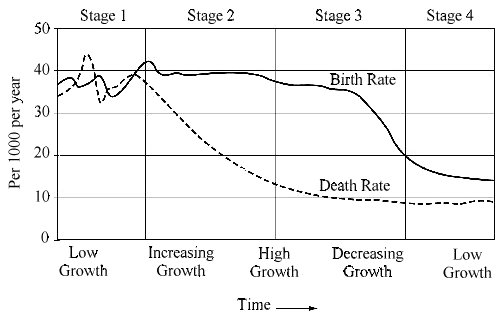
B) Demographic Transition (Cycle)
1) Four Stages:
a) High stationary stage – high fertility and mortality, variable population, little long-term growth
b) Early expanding stage – high fertility, declining mortality
c) Late expanding stage – declining fertility, but as a result of already-low mortality, continuing significant growth
d) Low stationary stage – low fertility and mortality, very low rate of growth
2)
Based on the
European model (e.g.
3) Developing countries
a) Population base is larger,
b) Affected by 1st world nations
c) Signs that population “bomb” may be declining
CHAPTER
6: Where and Why People Move
KEY
POINTS:
1)
Factors
that stimulate migration: conflict,
economic conditions, political strife, cultural circumstances, environmental
change, and technological advances.
2)
Migrants
move on basis of their perceptions of particular destinations; distance affects
accuracy of perception.
3)
Migration
usually takes place in stages. Rural-to-urban
movement occurs in steps, often from smaller to larger centers.
Migrants tend to relocate repeatedly after reaching their destination.
4)
Voluntary
migrants are stimulated by “pull” as well as “push” factors.
5)
Forced
migrations result from the imposition of power by stronger peoples over weaker
ones.
I. Perception and Migration
A. Absolute and relative distance
1. Absolute distance can be read on a map or globe
2. Relative distance can be changed by using an alternate route to get someplace—time factor
3. People's perceptions of both distance and direction are often greatly distorted
II. External and internal migration
A. Migration defined as: the long-term relocation of an individual, household, or group to a new location outside the community of origin
1. In the United States, natural increase of population is substantially lower than the overall growth which includes immigration from other countries
2. When migrants move from country to country, they become part of the vital statistics
B. Countries experience well-defined streams of internal migration that change over time
1. In the United States, African-Americans moved north during the early twentieth century
2. The attraction of the “sunbelt” in the United States
3. In China workers migrate from rural areas to cities of the Pacific Rim
III. Theories about migration
A. Ravenstein’s “laws” of migration
1. Net migration amounts to a fraction of the gross migration between two places
2. The majority of migrants move a short distance
3. Migrants who move longer distances tend to choose big-city destinations
4. Urban residents are less migratory than inhabitants of rural areas
5. Families are less likely to make international moves than young adults
B. Gravity model defined
IV. Catalysts of migration
A. Economic conditions
1. Poverty
2. Perceived opportunities in destinations
B. Political circumstances
1. Oppressive regimes
2. Cuba
3. Vietnam's "boat people"
4. Uganda
C. Armed conflict and civil war
1. Three million people driven from their homes in former Yugoslavia
2. Civil war in Rwanda
D. Environmental conditions
1. Potato famine in Ireland in the 1840s
2. Major earthquakes and volcanic eruptions
3. Many emigrants return home after the crisis is over
E. Culture and tradition
1. Muslims migrated out of India when it was partitioned
2. Jews left the former Soviet Union for Israel
3. Whites left South Africa during the turbulent political transition of the 1990s
F. Technological advances
1. Modern transportation makes migration easier
2. Air conditioning reduced return migration from the Sunbelt back to the north
G. Flow of information
1. Fast transmission of information by television, radio, and telephone
2. Allows people to migrate where jobs are available
3. Examples: Turks, Algerians, Haitians
H. "Push" and "pull" factors
1. Usually push and pull factors are combined in a person's decision to migrate
2. Push factors
a) Likely to be more accurately perceived
b) Include individual and personal considerations
3. Pull factors
a) Likely to be more vague
b) Many move on the basis of excessively positive images and expectations
I. A Sense of Scale box: Factors Influencing Migration
J. Distance decay (Figure 6-1)
1. Migrants more likely to have an accurate perception of nearer places
2. Less certainty about further away places
3. Step migration
a) Migrants may move to a near place first than move farther as they learn more about a location further away
b) Movement may be to a village, then a town, and finally a city
c) At each step new pull factors come into play
K. Intervening opportunity
1. Migrants may find opportunity before reaching their original destination
2. This happens to the majority of migrants around the world
3. Tourists (temporary migrants) also respond to this factor
a) May choose a closer place to vacation because of travel costs
b) A constant worry of long-range travel resorts
V. Voluntary and forced migrations
A. Luxury of choice and fear of compulsion
1. Distinction not always clear-cut
a) Potato famine in Ireland
b) British colonial rule over Ireland
B. Forced migrations
1. The Transatlantic Slave Trade
a) Estimated 12 to more than 30 million Africans removed from their homes (Figure 6-2)
b) Largest number were brought to plantations in the Caribbean and eastern South America
c) African slaves were brought to the United States in far fewer numbers
d) By 1800 the black population in the United States was just 1 million (misprinted in the text as 1900)
e) Nothing in human history compares to the Transatlantic Slave Trade
2. Convicts shipped from Britain to Australia beginning in 1788
3. In the 1800s, thousands of Native Americans were forced onto reservations
4. Forced migration during Stalin's ruthless rule in the former Soviet Union
a) Millions of non-Russians sent to Central Asia and Siberia
b) Accused of treason or obstruction of the communist grand design
5. Forced migration exists today in the form of counter-migration, when governments send back migrants caught entering their countries illegally
C. Voluntary migration
1. All voluntary migration flows generate a return
2. Any voluntary migration flow represents the numbers going from the source to the
destination minus those returning to the source
VI. Types of movement
A. Activity space
1. Daily routine
2. Magnitude varies in different societies
3. Technology has expanded daily activity spaces
B. Three types of human movement
1. Cyclic movement
a) Commuting
b) Seasonal
c) Nomadism
2. Periodic
3. Migratory
VII. The migration process
A Major modern migrations pre-1950 (Figure 6-3)
B. European emigration
1. Among the greatest migration in recent history was from Europe to the Americas
2. Perhaps as many as 75 million people left Europe
C. African forced migration
1. Slaves brought to the Caribbean
2. Most of West Africa was exploited during the taking of slaves
3. Cultural and ethnic geography of Brazil, Middle America, and the United States was changed by importation of slaves from Africa
4. British transported “indentured” workers from India, Pakistan, and Sri Lanka to East and South Africa
5. British relocated Asians to Caribbean countries
6. Example of Chinese in Southeast Asia (Figure 6-4)
VIII. External and internal migrations
A. Interregional migrations—people moving or being moved from one geographic realm to another
B. Internal migrations
1. In the United States, has carried the center of population westward and southward
(Figure 6-5)
2. African-Americans moved northward during World War I
a) Most came from rural areas
b) Starting in the 1970s more were leaving the North and returning to the South
c) Changed civil rights conditions
d) Perceived economic opportunities in the growing cities of the South
3. Eastward migration in Russia
a) Many moved from the heartland to the shores of the Pacific
b) Russian rulers built railroads and feeder lines and established Vladivostok
c) Migration rapidly declined following Soviet collapse
IX. Post-1945 external migrations
A. Flow of Jewish immigrants to Israel
1. In 1900, there were probably fewer than 50,000 Jewish residents in what was then
Palestine
2. By 1948 there were probably about 750,000 Jewish residents
3. Israel was formed in 1948 through UN intervention (Figure 6-6)
4. The area has become a flashpoints in the modern world
B. German migration after World War II
1. Migrated westward from Eastern Europe
2. Many were forced
3. Millions left Europe for other parts of the Western World
C. From Mexico to the United States
1. Most movement north has been unauthorized and cannot be documented
2. Legal immigration has surpassed 3 million since 1961
3. Has transformed borderland of the United States
D. Other migrations
1. Asia during the 1990s
2. Only 10 percent of immigrants have been from Europe between 1960 and 2000
3. Many left their homelands after World War II to help rebuild Europe
E. Migrations to North America
1. From Middle America, East and Southeast Asia
2. Majority of Cuban immigrants arrived and stayed in Greater Miami area
X. Migration and dislocation: the refugee problem
A. Large-scale population movements tend to produce major social problems
1. World’s refugee population proportionately has grown faster than its total population
2. In 1970, the world had about 2.9 million refugees
3. In 2000, the United Nations High Commission for Refugees reported some 24 million people qualified as refugees
B. Uncertain dimensions
1. Problem of defining who is a refugee
2. UN definitions
a) International refugees—those who have crossed one or more international borders and encamped in a country other than their own
b) Intranational refugees—those who have abandoned their homes but not their countries
3. Difficult to distinguish between refugees and poor or desperate migrants
4. In Jordan, Palestinian refugees have become regarded as permanent refugees
5. In Lebanon, other Palestinians wait in refugee camps for resettlement and still qualify as temporary refugees
6. Refugees can be identified by at least three characteristics, individual or aggregate
a) Most refugees move without any more tangible property than they can carry or transport with them
b) Most refugees make their first "step" on foot, by bicycle, wagon, or open boat
c) Refugees move without the official documents that accompany channeled migrations
C. Regions of dislocation
1. Sub-Saharan Africa
a) Several of the world's largest refugee crises plagued Africa during the 1990s and early twenty-first century
b) Hostilities between the Hutu and Tutsi in Rwanda and The Congo
c) Flows of refugees to other countries caused the death of hundreds of thousands
d) Problems in Sudan, Tanzania, and Uganda
e) Civil wars in Liberia, Sierra Leone, and Angola
2. North Africa and Southwest Asia
a) Israel and the displaced Arab populations that surround it
b) Exhibits qualities that are likely to generate additional refugee flow in the future
c) Example of the Kurdish population after the Gulf War—a stateless nation
(Figure 6-8)
d) Example of Afghanistan after the Soviet invasion during the 1980s
e) Taliban rule in Afghanistan created even more refugees
3. South Asia
a) Pakistan accommodated Afghanistan’s forced emigrants
b) Other major refugee problem stems a civil war in Sri Lanka
4. Southeast Asia
a) Boat people who fled communist rule in Vietnam
b) In the early 1990s, Cambodia generated the region's largest refugee flow
c) Today, the largest refugee numbers are reported from Myanmar (Burma)
5. Europe
a) Collapse of Yugoslavia created the largest refugee crisis since the end of World
War II
b) The UNHCR still reports as many as 2.1 million intranational refugees in former Yugoslavia
6. Elsewhere (Figure 6-8)
a) In the Western Hemisphere, only Colombia in 1997 has a serious refugee problem
b) The Earth’s refugee population is a barometer of the world’s future
CHAPTER
7: Policy Responses to Demographic Changes
I. Role of the United Nation
A. Population conferences
1. Held every ten years
2. First held in 1974 in Bucharest
a) Population explosion was in full force
b) Marred by ideological disputes
c) Chinese felt population control was a capitalist plot to inhibit growth of communist societies
d) Soviet Union encouraged large families
e) Majority of world's governments agreed on the urgency of overpopulation
3. Second conference in 1984 in Mexico City
a) China had reversed its position on population growth
b) The Green Revolution had narrowed the food gap
c) The United States kept a low profile
4. The 1994 Cairo conference
a) Religion became a dividing force
b) Catholics were afraid abortion and artificial means of birth control would be endorsed
c) Some Islamic countries asserted population control measures were inconsistent with Muslim precepts
5. 2004 conference
a) When women have access to education and paid employment birth rates decline
b) Religious fundamentalism can work against the interests of women in society
II. National population policies
A. Introduction
B. Three groups of population policies
1. Expansion population policies
a) Encourage large families
b) Use of tax incentives and other fiscal means to encourage more children
c) Used by countries where the population has stopped growing: example of Singapore
2. Eugenic population policies
a) Some were designed to favor cultural sector of the population over another
b) Until the time of the Civil Rights movement, some accused the United States of pursuing social policies tinged with eugenics that worked against interest of African- Americans
c) Japan’s nearly homogeneous culture is sometimes said to result from deliberate eugenic social policies
These policies can be practiced covertly through discriminatory taxation
3. Restrictive population policies
a) Toleration of officially unapproved means of birth control
b) Outright prohibition of large families
c) Can have unintended consequences
4. Limitations
a) Urbanization and industrialization inhabit population growth more effectively than restrictive population policies
b) Education of women in male-dominated societies helps more than sex education
c) Restricting immigration of foreign workers does more to age a population
5. Contradictions
a) Natural increase is at its lowest in heart of Roman Catholic world
b) Philippines locked in battle between government and church over birth control
c) Saudi Arabia has one of the globe’s fastest growth rates
d) Indonesia’s family-planning came to be regarded as most successful in the Muslim world
III. Three case studies
A. Japan
1. During era of expansion having several children was encouraged
2. Growing urban centers tended to reduce birth rate
3. Growth rate tended to stabilize
4. Circumstances changed after World War II
a) Hundreds of thousands of refugees returned from the colonies
b) Soldiers came home to rejoin their families
c) American occupation introduced improved medical services and public health
d) Birth rate increased and death rate dropped
5. In 1948 the government started the Eugenic Protection Act
a) Legalized abortions for social, medical, and economic reasons
b) Contraceptives were made available
6. Enormous number of abortions brought down the birth rate
7. Birth rate was over 34 per 1000 in 1947
8. Birth rate fell to 18 per 1000 by 1957
9. In 1991 the government increased benefits to parents to encourage larger families
10. Japan will not allow foreign workers in any numbers into the country
11. Japan will probably turn to technology to replace the loss of young workers
12. No measures will probably protect Japan from negative population growth
B. India
1. Predicted to overtake China as the world's most populous country during the first half of the twentieth-first century
2. Population is now approaching 1 billion
3. A culturally complex country (Figure 7-1)
a) Has 25 states
b) Seven so-called union territories
c) Because the states differ both culturally and politically, the will of the federal government cannot be forcibly imposed
4. Population planning
a) Began in the 1950s with limited funds
b) Leaders not aware of the dimensions of the population explosion then existing
c) The 1960 census encouraged government to spend more money
d) A national program was instituted
(1) Upward spiral continued, especially in eastern states
(2) Maharashtra State required sterilization of anyone with three children
(3) Forced sterilization caused social problems and led to rioting
e) India uses advertising and persuasion to help control family size
f) Some areas are progressing
C. China
1. Mao Zedong was against population control
2. In 1979 the government launched a policy inducing couples to have only one child
a) Applied loosely at first, which did not work
b) Severely tightened in 1982
c) Dramatic reduction in the growth rate occurred
3. Penalties and hardships of the one-child policy
a) If a second child was born, one parent had to be sterilized
b) Farming families had no one to help do the work and defied the authorities
c) The government fired offenders from their jobs
d) Women were arrested and forced to have abortions
4. In 1984 China relaxed its one-child policy in rural areas
5. Results of party-imposed system breakdown
a) Enforcement weakened
b) Circumvention practices became more effective
c) Peasants with rising incomes could afford to pay fines for unauthorized births
6. By year 2000 growth rate was 0.9 percent
7. The one-child policy has had a major social impact in a society where sons carry on the family name
a) Female infanticide—hundreds of thousand went unreported
b) Estimated number of surviving male children exceeded females by 300,000 annually
b) In the future males will substantially outnumber females
c) Unpredictable social consequences
8. China's policy toward zero population growth tore down the traditions of Chinese society
9. Government feels the ends justify the means
10. China's experience underscores the depth of the population dilemma
a) Stringent policies could not be enforced over the long term
b) Short-term gains were wiped out over the long term by reverses
IV. Policies targeting migration
A. Control of immigration, legal and illegal a hot issue around the world
1. If the federal government cannot control its borders in the U.S., states feel it should foot the bill
a) California demands federal help to provide services for hundreds of thousand of illegal immigrants
b) Cuban refugees
c) Haitians were prevented from entering Florida
2. Restricting migration is nothing new
a) Great Wall in China
b) The Berlin Wall
B. Legal restrictions
1. In the United States the Oriental Exclusion Acts (18821907) were designed to restrict the immigration of Chinese people to California
2. Australia Immigration Restriction Act of 1901 terminated all nonwhite immigration
3. In the United States—restrictive legislation affecting Europeans was passed in 1921
4. In the United States—the National Origins Law took effect in 1929
a) Sustained the limit of 150,000 immigrants per year
b) Had the effect of preventing the immigration of Asians
5. After 1940 U.S. restrictions on immigration were modified
a) China given equal status with European countries
b) Japan given similar status in 1952
6. The law was modified in 1952
a) Incorporated all preceding legislation
b) Established quotas for all countries
7. Many immigrants enter the United States as refugees
8. In 1965, the United States quota system was abolished
9. Other countries also have immigration laws many practice selective immigration
a) South Africa demanded “pure” European descent
b) New Zealand favored persons of British birth and parentage
c) Brazil preferred people with a farming background
d) Today South American countries place limits on the number of immigrants through quota systems
10. As the world’s population mushrooms, the volume of migrants will expand